|
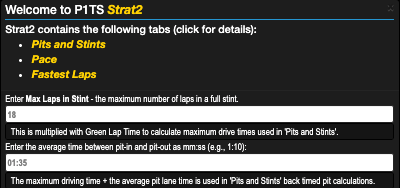
When Strat 2 is started, this additional screen prompts you for
session specific data. In our examples, we've used the following
values for the 2020 IMSA IMPC Road America Race:
|
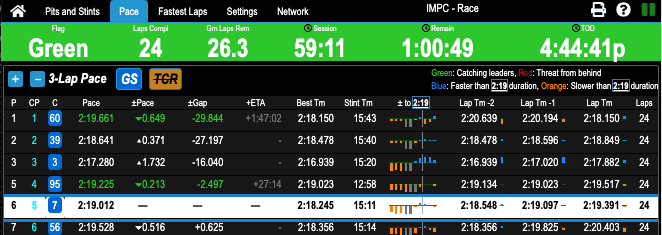
The Pits and Stints panel plots competitors's completed and predicted pit stop and driver change strategies on a time line.
Green Lap Time intervals.Green Lap Time x Max Laps in Stint intervals
for Avg Pit Lane Time duration.Green Lap Time x Max Laps in Stint intervals
from the Finish.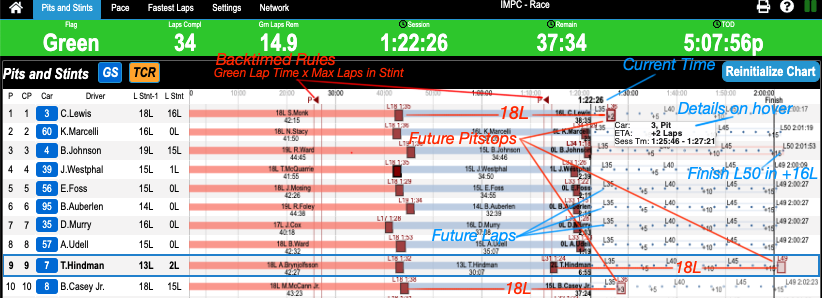
Avg Pit Lane Time
1m 35s spacing (as are all future pit stop boxes)Green Lap Time x
Max Laps in Stint spacing (2m 32s x 18L = 46m 30s)